When comparing the debt markets to the S&P 500 Index, famed financial journalist James Grant called them “illiquid and inefficient,” adding that it’s “part of their charm.” While we agree with Grant that the debt markets do have plenty of charm, our affinity for them is rooted in our belief that over longer periods of time they are stacked in favour of active managers.
There are many options out there for fixed income investors that cover all areas of the Canadian, U.S., and global bond markets. Investors must attempt to balance risk, return, and fees as they choose to allocate capital to fixed income. Fees are generally lower on passive fixed income vehicles due to the lack of analytical resources required, but lower upfront cost should not be the differentiating factor when choosing between active and passive management. Rather, the focus should be on what will be more likely to generate better returns in the long run. At Burgundy, we believe that an active approach to fixed income can generate stronger returns while also offering a greater degree of downside protection and proving more beneficial over the long term than a passive approach. This thesis is predicated on our view that passive investing in fixed income isn’t actually “passive” at all, that it is a fundamentally flawed approach to fixed income investing, that it exposes investors to constantly changing risks, and that there are structural factors in fixed income markets that favour active managers.
Is Passive Investing in Fixed Income a Misnomer?
Passive investing in fixed income is actually anything but passive. We often think of passive investing as buying an exchange traded fund (ETF) that holds the same securities in the same proportion as the S&P 500 Index or the S&P/TSX Composite Index. While these indices evolve over time, they do not change with anywhere near the frequency of fixed income indices. The FTSE Canada Universe Bond Index is comprised of approximately 1,500 bonds today, up from less than 1,000 in 2005. Over that time, the index has averaged approximately 15% portfolio turnover annually. That equates to approximately 170 additions to and 130 deletions from the index each year. Just to match the securities in the index would require approximately 300 trades every year, which does not account for the rebalancing required when securities are added or removed from the index.
Replicating a fixed income index involves a significant commitment to active trading, and trading is not without its costs. The bid-ask spread (the difference between the price a manager pays to buy or sell a security) is a cost borne by investors. Active managers also pay the bid-ask spread, but they have the ability to choose when and why they transact. Given the cost and the amount of trading required to continually replicate the index, it is no surprise that many ETFs do not actually replicate the index. In many cases, the differences are large enough to have an impact on performance.
Figure 1 highlights the composition of three well-known fixed income ETFs in Canada, which combined held approximately C$12 billion of assets as of December 31, 2019. Of particular note, among many differences in composition, is that one of these ETFs holds only approximately 64% of the bonds that are index eligible, therefore attempting to recreate index performance with less than two-thirds of the securities that are held in the index.
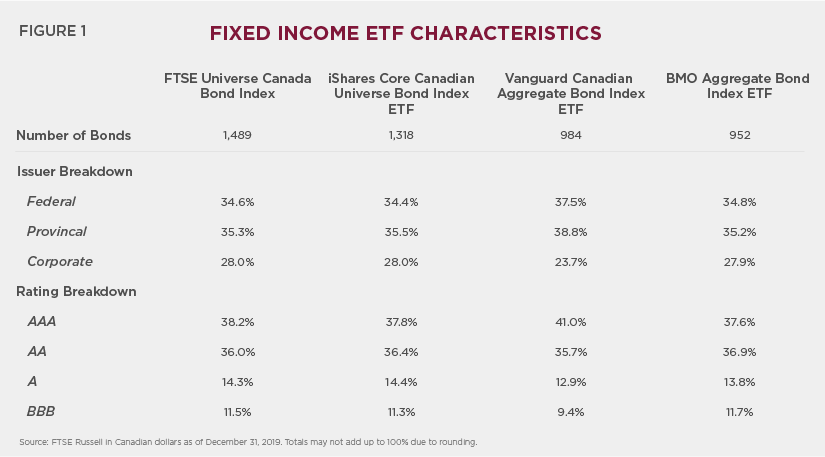
Although seemingly small, the differences in composition of each ETF relative to the index are large enough to meaningfully affect long-term performance. These differences exist with good reason, primarily because many bonds currently in the index were issued 10 or even 20 years ago and due to their smaller issue sizes cannot be bought today. These bonds are incredibly illiquid, meaning that many ETFs today cannot practically replicate the index holdings even if they wanted to.
Passive fixed income managers are not actually managing a passive portfolio in the way most investors interpret the notion of passive. Due to consistent turnover in fixed income indices and the lack of liquidity in large parts of the fixed income market, we assert that passive fixed income investing is merely a euphemism for actively attempting to generate index returns. Going forward, we will refer to what is traditionally termed as passive investing as index-based investing.
Assuming that most investors who invest in an index-based strategy are less concerned with portfolio composition and really just looking for index returns, it is worthwhile to ask if they are being appropriately served. Using the same three ETFs depicted earlier, we see that investors are not achieving index returns over the long term. Index-based strategy returns have failed to match index returns in almost every single calendar year and are equally lackluster when annualized over longer periods, as seen in Figures 2 and 3.
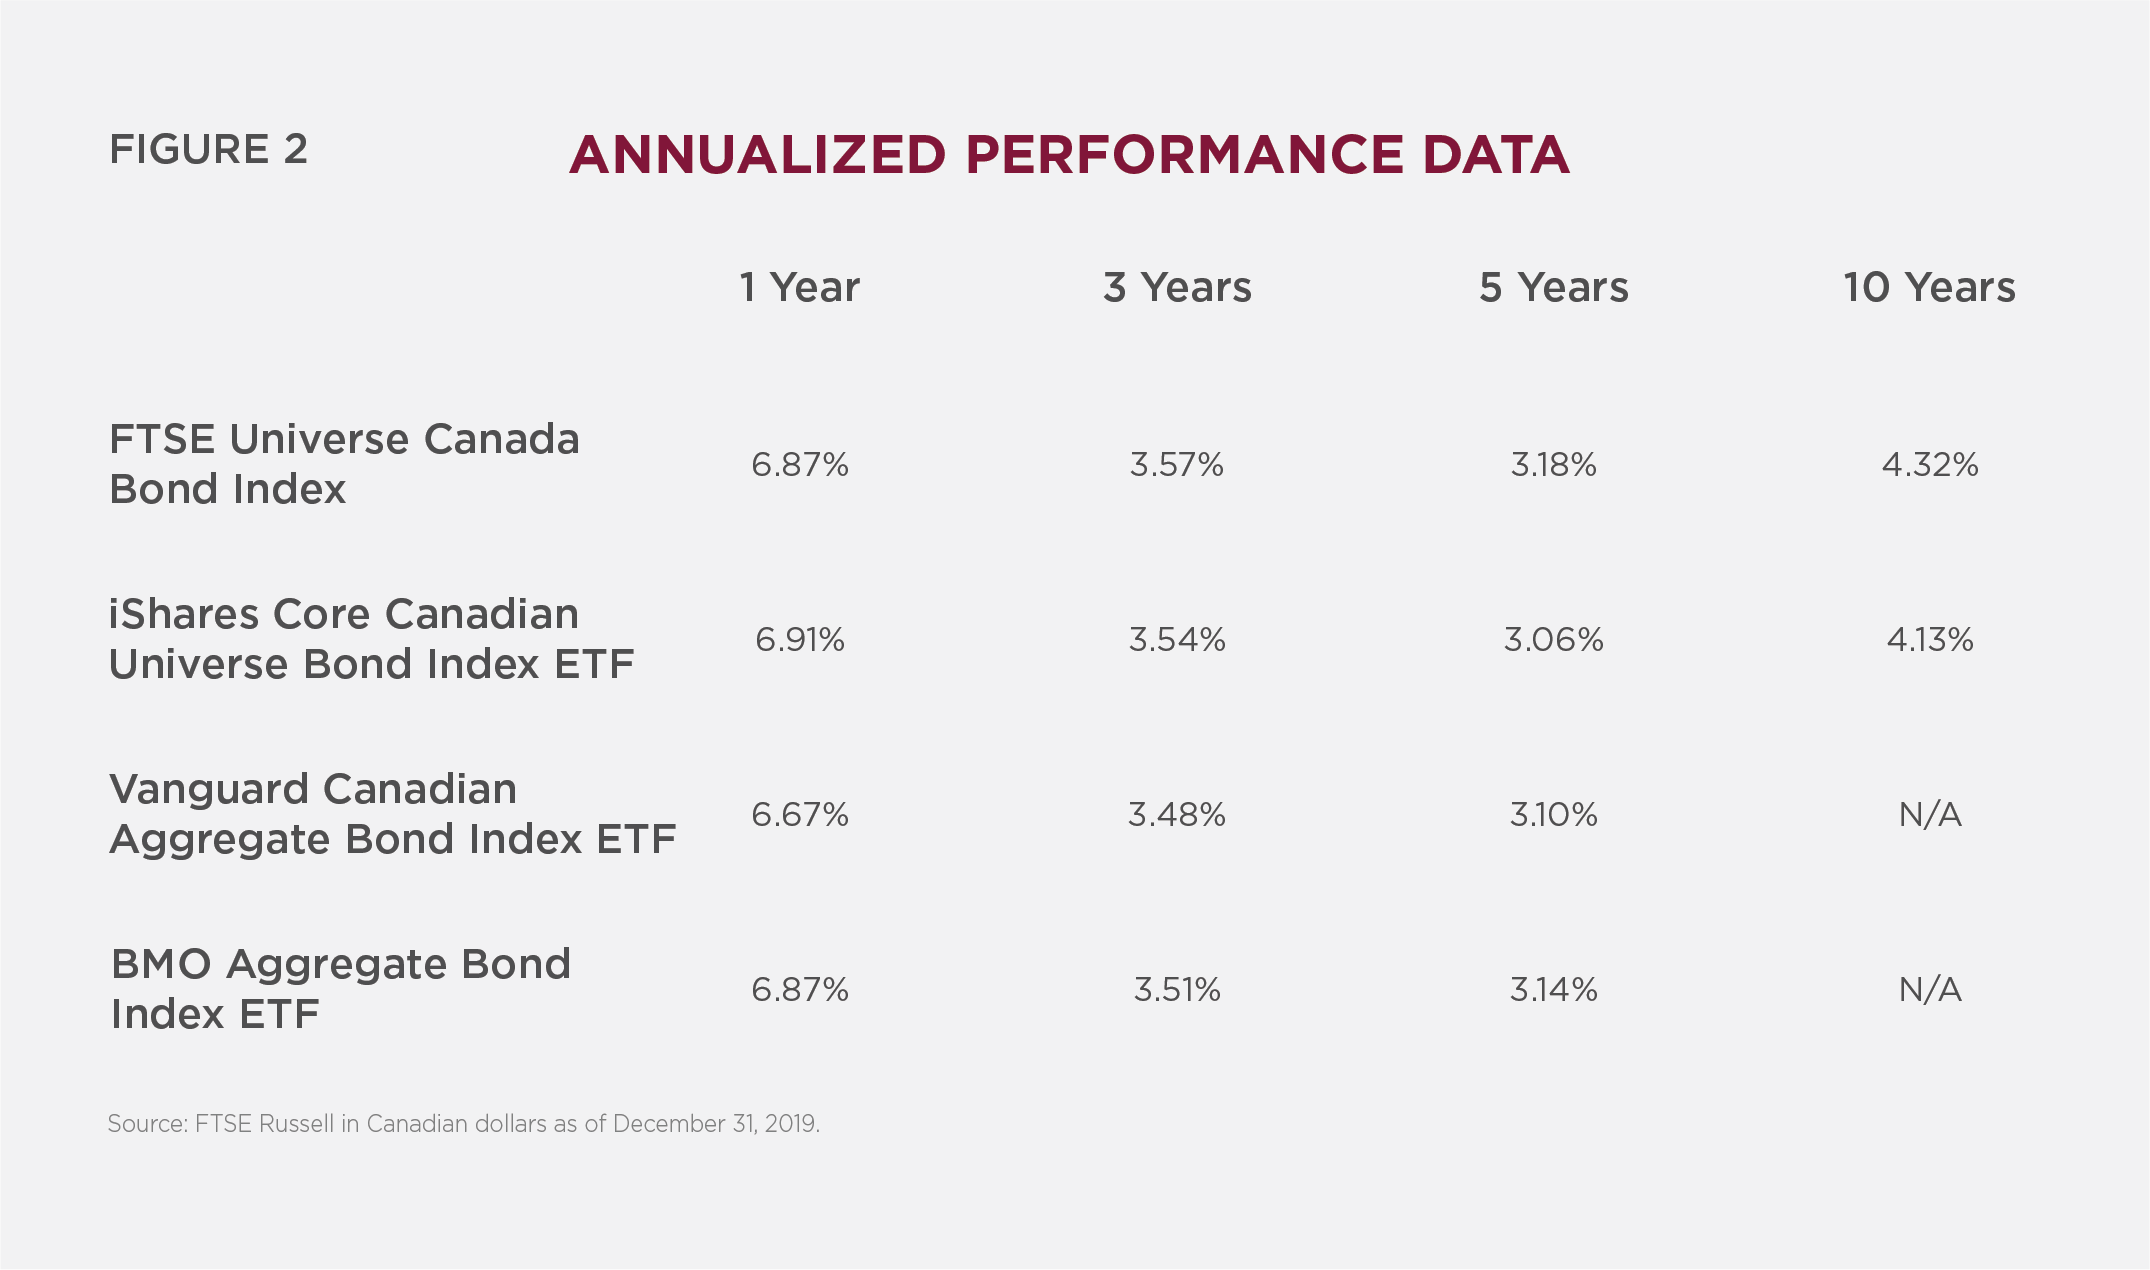
Note: The inception years of Vanguard Canadian Aggregate Bond Index ETF and BMO Aggregate Bond Index ETF are 2011 and 2010 respectively and, as a result, a 10-year return is unavailable to December 31, 2019.
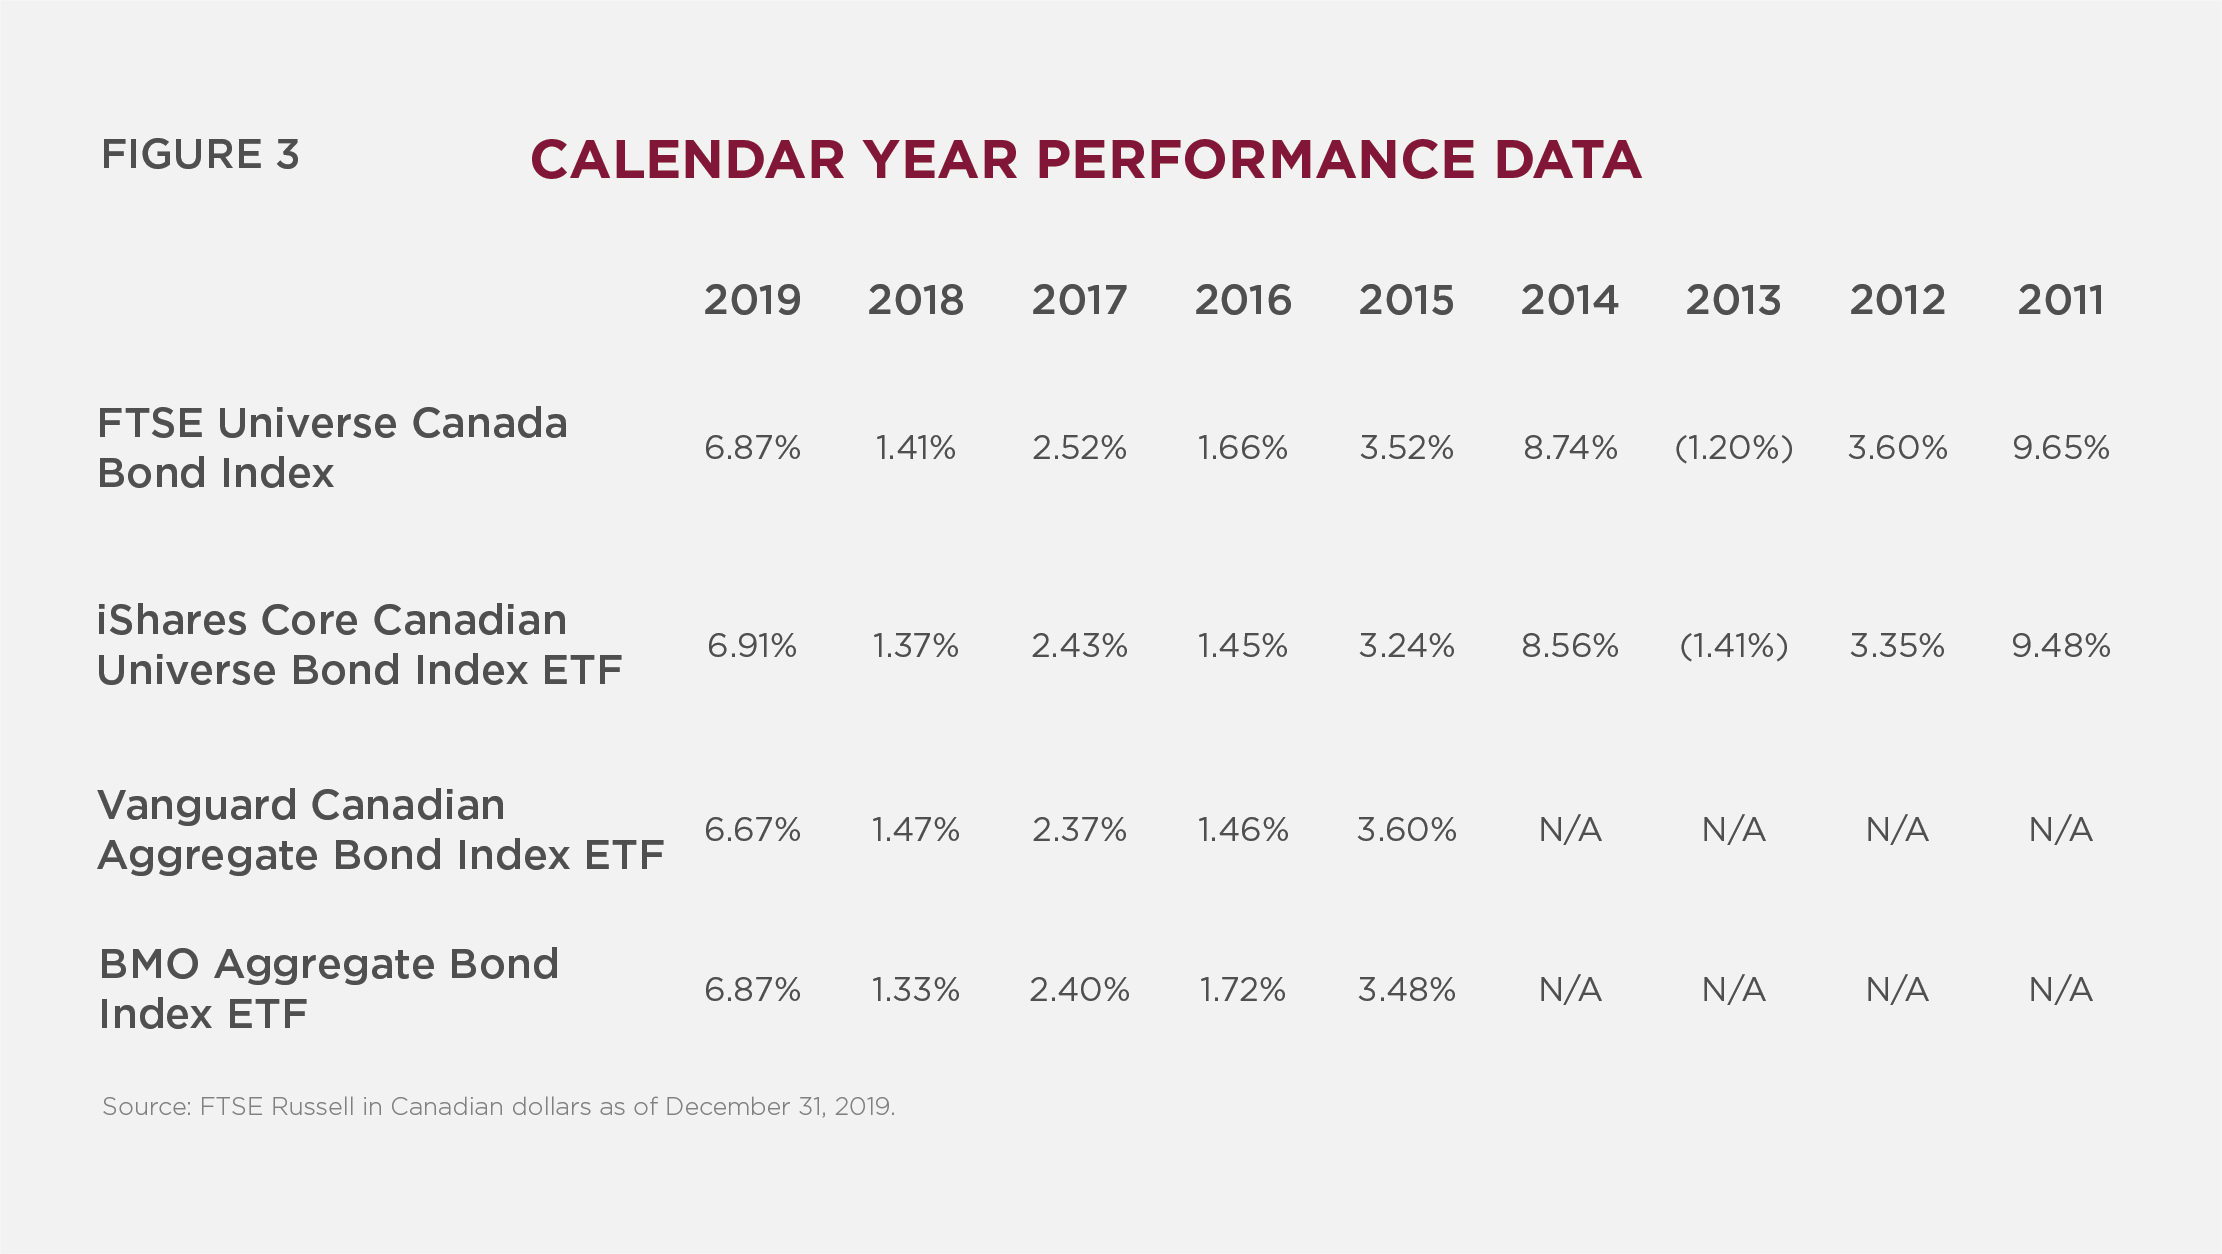
Since these strategies fail to replicate the index holdings, the index composition, or the index returns, it is hard to consider them passive in the traditional sense. They are merely active strategies attempting, unsuccessfully in most cases, to generate index returns. If investors are effectively invested in an active strategy, we believe that they are better served investing with a manager that employs genuinely active, independent thought in the investment and security selection process as opposed to one that follows a strategy driven by index eligibility criteria.
Fundamental Flaws of Index-Based Investing in Fixed Income
At Burgundy, we believe that investment decisions should be made following the completion of a rigorous analytical research process. This is particularly true with regards to fixed income due to the asymmetric return profile of bonds. The best-case scenario when purchasing a bond that you intend to hold to maturity is that you receive periodic interest payments, the principal is repaid, and that, ultimately, an investor earns the return he or she signed up for. Conversely, the worst-case scenario is that an investor gets nothing back and the company defaults. This return profile means that picking winners, while ideal, is less critical than avoiding losers when it comes to generating long-term returns. The very definition of index-based investing means that it exposes investors to all issuers and fails to employ any analysis or put forth any effort into avoiding those losers.
As with many equity indices, fixed income indices are generally constructed as market-weighted indices. This means that a company or government that issues the largest dollar amount of debt will have the largest weight in the index. In the case of equities, market-weighted indices make sense as the company with the largest market capitalization would ultimately represent the largest holding in an investor’s portfolio. However, having the largest exposure to the largest debt issuer may not always make sense. That is not to say that a company that issues a lot of debt isn’t creditworthy, but rather that high absolute debt loads present risks to a fixed income investor.
To best highlight the flaws of a market-weighted approach, let’s explore an extreme example. A debt issuer could continually issue debt to the brink of default or, more likely, to the brink of a rating downgrade that would render them ineligible for index inclusion. All the while, an index-based strategy would be purchasing this debt in proportion to its weighting in the index. Both default and removal from an index would have a significant negative impact on the price of any bond issued by that entity. As a result, due to its mandate of matching the index, an index-based strategy would likely be required to sell all the bonds of that issuer once they are excluded from the index, thus solidifying any loss that has been generated. Furthermore, if issuers were consistently paying down their debt to improve their credit profile, it would likely have a positive effect on the prices of their remaining outstanding bonds. In this circumstance, an index-based strategy would continue to sell bonds of these issuers as their relative weights in the index declined. In summary, it is possible (under the right circumstances) that an index-based strategy would continue to buy bonds of an issuer with a deteriorating credit profile while selling bonds of an issuer with an improving credit profile. In practice, these extreme scenarios are improbable, but they do highlight the fact that this type of rules-based investing strategy may have unintended consequences.
In a more realistic scenario, index-based investors may find themselves increasingly exposed to issuers that may be taking incremental risks with their balance sheet. While there is no guarantee that any research process or analyst can consistently uncover deteriorating credit profiles, the probability of doing so is certainly greater than zero. An index-based approach, however, assures an investor’s exposure to all eligible issuers and therefore offers no protection from deteriorating credit profiles. The opportunity for active managers to avoid, or underweight, deteriorating credit profiles should ideally lead to outperformance relative to an index over time.
Ever-changing Composition of Fixed Income Indices
As market conditions and issuance patterns change, the composition of an index will also change. This could result in an investor ending up with a portfolio that looks drastically different over time relative to their initial risk and return expectations. The change in composition may be in terms of interest rate risk, expected return, credit risk, or by sector weightings. Using the FTSE Canada Bond Universe Index as an example, we explore how this index has changed over time.
INTEREST RATE RISK & EXPECTED RETURN
Figure 4 highlights that investors in a strategy designed to track this index have seen their interest rate risk, as measured by duration, increase significantly. For every change in market interest rates, the impact on a portfolio’s return becomes greater. Meanwhile, an investor’s expected return (as measured by yield to maturity), has declined markedly over this same time period.
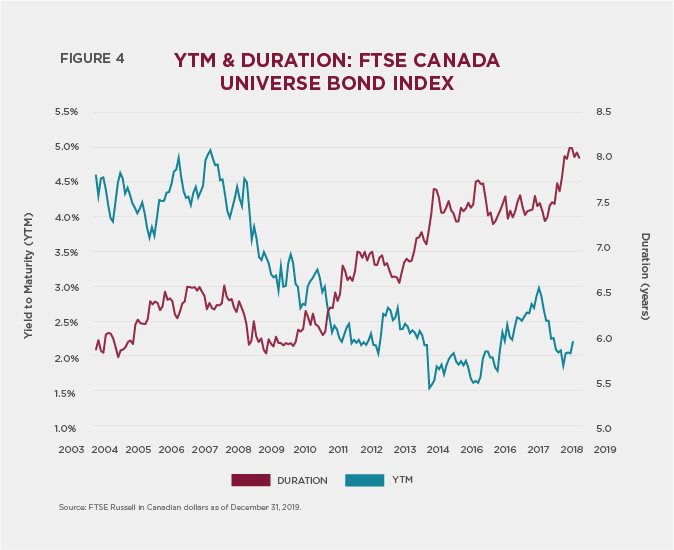
Duration has increased from approximately 5.75 years in 2003 to approximately eight years currently, while the yield on the index has declined from approximately 4.5% in 2003 to less than 2% today. This effectively serves to increase the volatility of the index while lowering the expected return – something that is generally considered unappealing to investors. Academic theory tells us that higher volatility should lead to higher returns, but this index is producing the exact opposite of that. While this is largely a result of central bank policy following the global financial crisis, it doesn’t change the fact that an investment in this index has morphed into a higher-volatility and lower-return investment than one may have initially expected. An active manager, however, is able to construct a portfolio tailored to a specific investor’s needs. Due to changing market conditions, it may not be possible to recreate the risk/return profile of this index 15 years ago; nevertheless, active managers can alter duration and expected yield to maturity to more closely align with a given investor’s preference.
SECTOR WEIGHT & CREDIT QUALITY
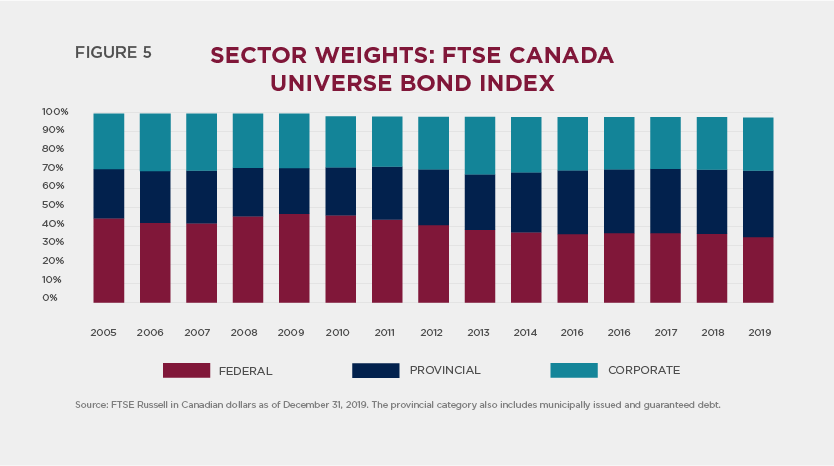
Sector weightings in any index are subject to change over time, regardless of the construction methodology used. Funds based on this index, as demonstrated in Figures 5 and 6, have seen drastic changes in the broad risk profile of their investment over time. In these instances, an investor that bought the index in 2005 would have a portfolio made up of approximately 45% federally issued or guaranteed securities, 26% provincially issued or guaranteed securities, and 29% corporate bonds. At the end of 2019, that evolved into approximately 35% federally issued or guaranteed securities, 35% provincially issued or guaranteed securities, and 30% corporate bonds.
Similar to the breakdown by sector, the composition of the index by credit quality (as measured by rating) has changed significantly as well. In 2005, the index was approximately 49% AAA-rated, 21% AA-rated, 26% A-rated, and 4% BBB-rated. In 2019, that composition evolved to 38% AAA, 36% AA, 14% A, and 11% BBB.
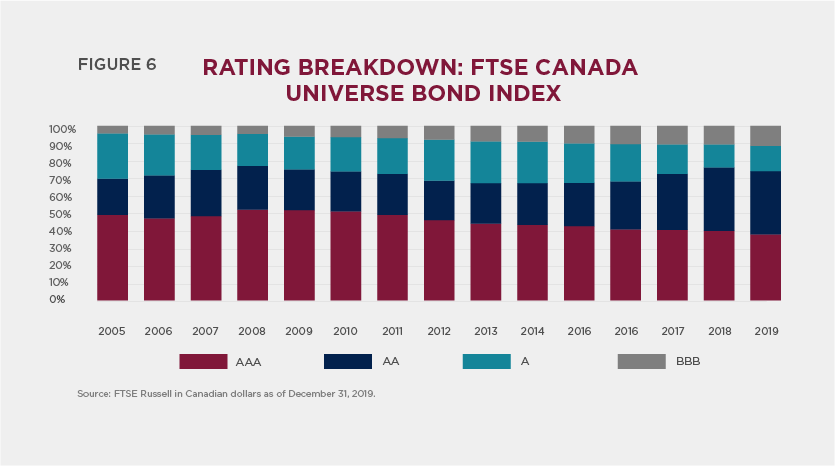
Since provincial bonds are typically lower rated than federally issued bonds, this rating composition shift makes a lot of sense when compared against the shift in sector weightings. While this explains the shift in weighting from AAA-rated bonds to AA, it does not explain the increase in BBB-rated bonds. The increase in BBB-rated bonds is a function of increased leverage on corporate balance sheets that has led to widespread downgrades by rating agencies. This was further exacerbated following the global financial crisis as central bank policy drove down interest rates and encouraged borrowers to take on increasingly larger debt burdens.
While fixed income indices are generally designed to be representative of the broader market, there is no question that over time fixed income indices have experienced a decline in credit quality. This is represented through both a change in sector composition and a change in credit rating composition.
To summarize the changing characteristics of the FTSE Canada Universe Bond Index since 2005: Interest rate risk has increased, credit risk has increased, and expected return has decreased. These are not desirable changes for investors and there is no evidence that these changes will reverse anytime soon. Despite the existence of these characteristics within the Index, active managers can adjust them within a portfolio to better suit an investor’s needs. For instance, they may own more federal government-issued bonds for more risk-averse investors, lower duration bonds for investors that prefer lower volatility in their portfolio, or more lower-rated corporate bonds for investors seeking a moderately higher return profile. Active managers may also choose to alter these characteristics in their portfolio based on market conditions and relative value among sectors, credit ratings, or even individual issuers. An active manager that engages in fundamental credit research will attempt to ascertain which issuers have deteriorating credit profiles and avoid them. Avoiding these issuers prevents the portfolio from suffering a permanent impairment of capital in the event of either a default or a ratings downgrade.
At Burgundy, we utilize all of the aforementioned tools in our attempts to generate long-term returns; however, our primary focus is on performing fundamental credit research. We believe that our diligent research process, which includes significant overlap with the work conducted by Burgundy’s equity analysts, makes us better equipped to detect, and therefore avoid, deteriorating credit profiles while also being able to identify improving credit stories. This focus on fundamental research extends beyond just what is included in a specific index. Depending on the mandate guidelines, we are able to invest in securities that are not index eligible due to either the size of the bond issue, the currency in which it was issued, or the credit rating assigned by a bond rating agency. The expansion of our investable universe allows us to construct a portfolio with a more attractive risk/return profile while making greater use of the broad research capabilities within Burgundy’s investment team.
Structural Advantages for Active Fixed Income Managers
There are two specific structural aspects of fixed income markets that give active managers an advantage relative to index-based fixed income strategies. First is the concept of the new issue concession, and second is the proliferation of non-return-seeking participants in fixed income markets.
NEW ISSUE CONCESSION
New issue concession refers to newly issued bonds that are typically issued at a slight discount relative to the level at which existing bonds trade in secondary markets. New issues are priced at a small discount in order to attract a sufficient number of buyers to ensure that the transaction is successful. A failed bond issue is a very negative signal for both the issuing company and the market as a whole. As such, a small price concession to ensure there is little to no risk of this happening is a fairly standard part of the new issue process. Given that these new bonds are typically issued at a slight discount, it stands to reason that upon pricing they will immediately trade up, or increase in price, to match existing bonds issued by the company that are already in the market. In reality, this usually entails a combination of the new bonds trading up and the older bonds trading slightly down to equate their value. This allows an owner of the new bond to immediately reap a small gain, known as the new issue concession.
Most fixed income indices are updated daily using all bonds’ closing prices. This means that if a newly issued bond is issued at par, or $100, and trades up to $101 by the end of the day, it will enter the index at a price of $101, leaving the active manager with a small gain that is never recognized by the index. In practice, most bonds do not enter the index for a couple of days after they are issued because the index provider must verify eligibility prior to a bond’s inclusion in the index. This increases the lag in the aforementioned example and can, if the bond continues to trade higher, exacerbate the gain that an active manager can earn that is not captured by the index. Most strategies that attempt to track a specific index do not typically add a new bond to their portfolio until it has been officially included in the index, thus they also miss out on the initial gain as a result of the new issue concession.
The new issue concession is usually small in the grand scheme of the value of a bond, and therefore the gain that can accrue to the active manager is also very small, especially in the context of an entire portfolio of several different bonds. Unlike in equity markets, though, there is a significant amount of new issue activity every year in the corporate bond market. In 2019, for example, 144 newly issued corporate bonds were added to the index in Canada alone. This is in addition to numerous corporate bond re-openings and provincial new issues and re-openings. While each individual new issue concession may be small, this remains a consistent and readily available source of alpha generation accessible to active fixed income managers.
ALTERNATIVELY MOTIVATED MARKET PARTICIPANTS
Investors operate under the assumption that all market participants are trying to maximize return while minimizing risk. In fixed income markets, however, there are participants whose primary goal is not to maximize their return. Many participants utilize bonds for other reasons and therefore try to maximize or minimize some other variable. While the return may still be important to these entities, their investment criteria are more likely to treat return maximization as a secondary goal. These market participants may include pension funds and insurance companies.
Pension funds, insurance companies, and many other organizations are actually managing their portfolios to match future payouts, which is known as liability-driven investing (LDI). LDI’s goal is not to maximize return, but to maximize the probability of meeting future liabilities and match cash flows to the greatest extent possible. This type of strategy tends to require a significant amount of long duration bonds due to the long-term nature of these types of liabilities. This often leads LDI investors to maximize their duration, perhaps at the expense of expected return, or to target a specific duration while treating return maximization as a secondary goal.
So, how exactly does this provide an advantage for active managers relative to index-based strategies? In the case of LDI-driven mandates, where a manager is seeking to target a specific duration or cash flow profile, they may be willing to pay more than the market price for a specific bond that satisfies their alternate criteria while simultaneously selling a bond that doesn’t fit their criteria for less than the market price. This phenomenon may occur among bonds of the same issuer, same sector, or same credit rating. One bond that is in demand may have its price bid up, while the second bond, which is not in such high demand, may be priced lower; this allows the active manager to sell the higher-priced bond and buy the lower-priced bond with potentially no change in the risk profile of the active manager’s portfolio. The same principle applies to all other market participants that have a primary objective other than maximizing return – their pursuit of an alternate goal can distort market prices to the advantage of an active manager. This effectively acts as a transfer of return, in exchange for some other desirable trait, to the active bond manager.
“… index-based strategies in Canada do not keep up with the returns of actively managed funds over longer periods of time, both on an absolute basis and risk-adjusted using the Sharpe ratio.”
Testing Our Thesis
According to Mercer, an investment consulting firm that tracks return data for investment managers, the FTSE Canada Universe Bond Index ranks in the fourth quartile over the five-year period ended December 31, 2019 in a survey of 35 actively managed funds. The FTSE five-year annualized return of 3.18% compares to a median return of 3.32% and a first quartile return of at least 3.47%. Recall that of the three ETFs observed previously, the highest five-year annualized return was 3.14%. That return, along with the other two ETFs presented earlier, would have ranked in the lowest quartile among active managers over that time. Mercer paints a similar picture when looking at corporate bonds, where the FTSE Canada Universe Corporate Index also ranks in the fourth quartile over a five-year period.
Global Manager Research (GMR), another investment consulting firm, conducts a similar survey of investment returns and publishes data (where available) dating back 10 years. The “index” in the firm’s survey of actively managed core Canadian fixed income funds, which includes 65 funds, is the previously shown iShares Core Canadian Universe Bond Index ETF. This ETF consistently ranks in the bottom quintile over four, five, seven and 10-year periods of annualized returns. It also ranks in the bottom half of actively managed funds every calendar year dating back to 2010 and ranks in the bottom quartile in 60% of those calendar years. Consistent with this data, the ETF’s Sharpe ratio ranks in the bottom decile over five, seven and 10-year periods. This survey also shows that while active management and index-based strategies achieve similar results in up markets, active management significantly outperforms in down markets. As measured by GMR, active managers and the iShares ETF both capture, on average, approximately 100% of index performance in up markets. In down markets, the iShares ETF captures slightly greater than 100% of market performance compared to active managers who capture approximately 90% of down market performance. That active managers ultimately do a better job at protecting capital in down markets is something we believe most investors see as a desirable quality when selecting an investment manager.
GMR delivers a similar, albeit slightly less grim, message when comparing the iShares Canadian Corporate Bond Index ETF to its survey of 18 actively managed investment grade corporate bond funds. This ETF ranks consistently in the third quartile over three, five, seven and 10 years, while ranking in either the third or fourth quartile 90% of the calendar years dating back to 2010. The Sharpe ratio of this ETF also consistently underperforms, ranking in the fourth quartile over five, seven, and 10 years.
This data set makes it clear that index-based strategies in Canada do not keep up with the returns of actively managed funds over longer periods of time, both on an absolute basis and risk-adjusted using the Sharpe ratio.
Conclusion
At Burgundy, we prefer an active management approach to an index-based strategy. Passive investing in fixed income is not passive at all; using a market-weighted index is fundamentally flawed and may actually expose investors to additional credit risk; fixed income indices may change significantly over time, exposing investors to additional risks when they choose an index-based strategy; and finally, active managers benefit from the structural elements of today’s fixed income markets.
Ultimately, we believe the real arbiter of this debate is long-term returns. The return data shows very clearly that over longer periods of time, active management achieves stronger returns on average than index-based ETFs and the actual index itself.
We believe that active portfolio management based on a rigorous analytical framework of selecting the most attractive securities is the most effective way to generate stable, long-term returns and outperform the index. This is as true for fixed income as is it for any other asset class. Years of return data showing active managers outperforming index-based strategies over extended periods of time supports our view that active managers are better equipped to react to the distinct structure, illiquidity, and asymmetric return profile of fixed income securities.
Returning once again to James Grant: “Indexation and the bond market do not mesh, and are destined never to mesh…Investment in fixed income securities is for the active and analytically restless.” At Burgundy, we comfortably reside in the analytically restless camp.
Source: Burgundy research, FTSE Russell, Grant’s Interest Rate Observer, Mercer (Mercer’s Pooled Fund Surveys from 2019 and 2020), Global Manager Research (Institutional Performance Reports from 2019 and 2020)
The FTSE Canada Universe Bond Index is a broad measure of the Canadian investment-grade fixed income market, covering government, quasi-government and corporate bonds. It is designed to track the performance of bonds denominated in Canadian dollars, with at least one year of remaining effective term to maturity, a rating of BBB of higher and at least 10 institutional buyers. Bonds included must have fixed rate coupons, payable semi-annually with a minimum issuance size of $100 million for corporate bonds and $50 million for government bonds, including municipal and provincial bonds.
Active Management vs. Passive Investing – A Fixed Income Approach is provided for information purposes only and is not to be taken as investment advice, a recommendation or an offer of solicitation. The three external funds mentioned in this paper have been selected according to objective criteria as they are the main ETF options available. This update does not consider unique objectives, constraints, or financial needs. Burgundy assumes no obligation to revise or update any information to reflect new events or circumstances, although content may be updated from time to time without notice. Forward looking statements are based on historical events and trends and may differ from actual results. Under no circumstances does any commentary provided suggest that you should time the market in any way. Investors are advised that their investments are not guaranteed, their values change frequently and past performance may not be repeated.
All references to external performance data are made for illustrative purposes only and have been referenced here solely to provide context. The information included here is accurate as of the time of writing. The information provided here is for discussion purposes only and should only be interpreted as an expression of Burgundy’s individual perspective. For more information, please see our legal page.
Content provided in this piece includes proprietary information of Burgundy Asset Management Ltd. and is intended for the recipient only. This email is not to be distributed without consent from Burgundy.
Regarding distribution in the United Kingdom (UK), the content of this communication has not been approved by an authorised person within the meaning of the UK Financial Services and Markets Act 2000. This communication is provided only for and is directed only at persons in the UK reasonably believed to be of a kind to whom such promotions may be communicated by an unauthorised person pursuant to an exemption under article 49 of the Financial Services and Markets Act 2000 (Financial Promotion) Order 2005. Such persons include (a) bodies corporate, partnerships and unincorporated associations that have net assets of at least £5 million, and (b) trustees of a trust that has gross assets (i.e. total assets held before deduction of any liabilities) of at least £10 million or has had gross assets of at least £10 million at any time within the year preceding this communication. This communication is not intended for, nor available to, any organization that does not meet this criteria, or to whom it may not be lawfully communicated. Any such organization must not rely on this communication, whatsoever.

