With the right conditions, a young tree will grow quickly but, as it matures, its height growth slows to the point where it no longer advances. A Mountain Ash, for example, will grow two to three metres a year at an early age. This growth will slow to half a metre by age 90 and then stop growing altogether by 150. The total lifespan of a Mountain Ash is about 250 years. Scientists don’t know exactly why trees stop growing in height, but one theory is their height is limited by their ability to pull water from the roots to the leaves. As the tree gets taller, the force of gravity makes it more and more difficult to get water to the leaves, making it more difficult to grow.
The stock market cycle is much shorter than the lifespan of a tree, but the principle is similar. Like the growth of a tree, the early stage of a stock market cycle is often characterized by rapid growth. As time moves forward, gravitational forces make it harder and harder for the market to grow at the same rate as it did in years prior. For stocks, gravity is their valuation. As the cycle matures, stock prices move from undervalued to fully valued and (at times) overvalued, and investor expectations for growth should inversely move from high to moderate.
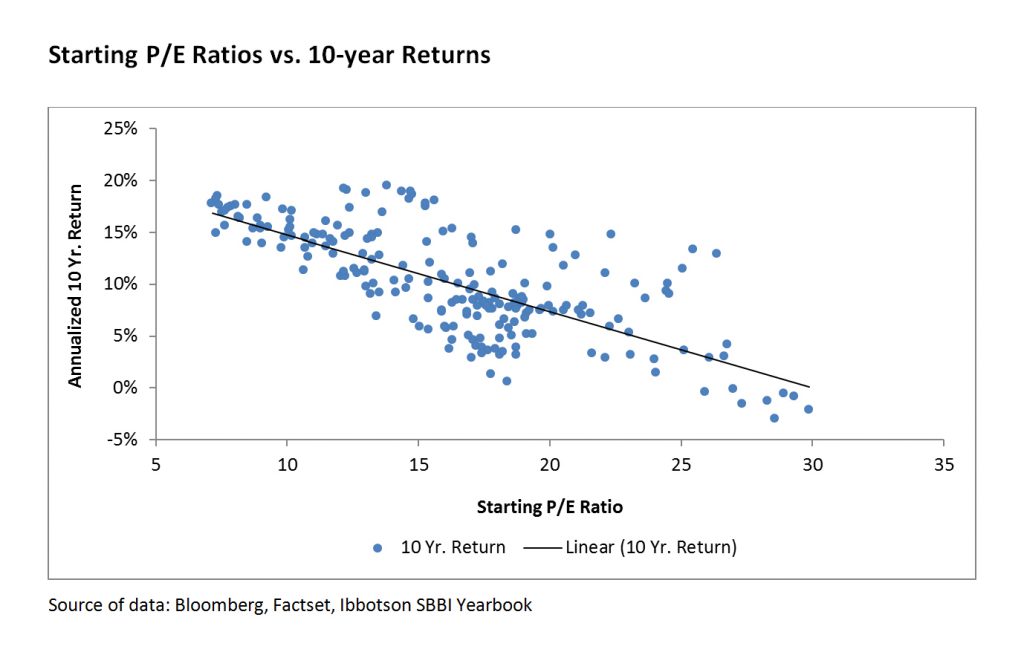
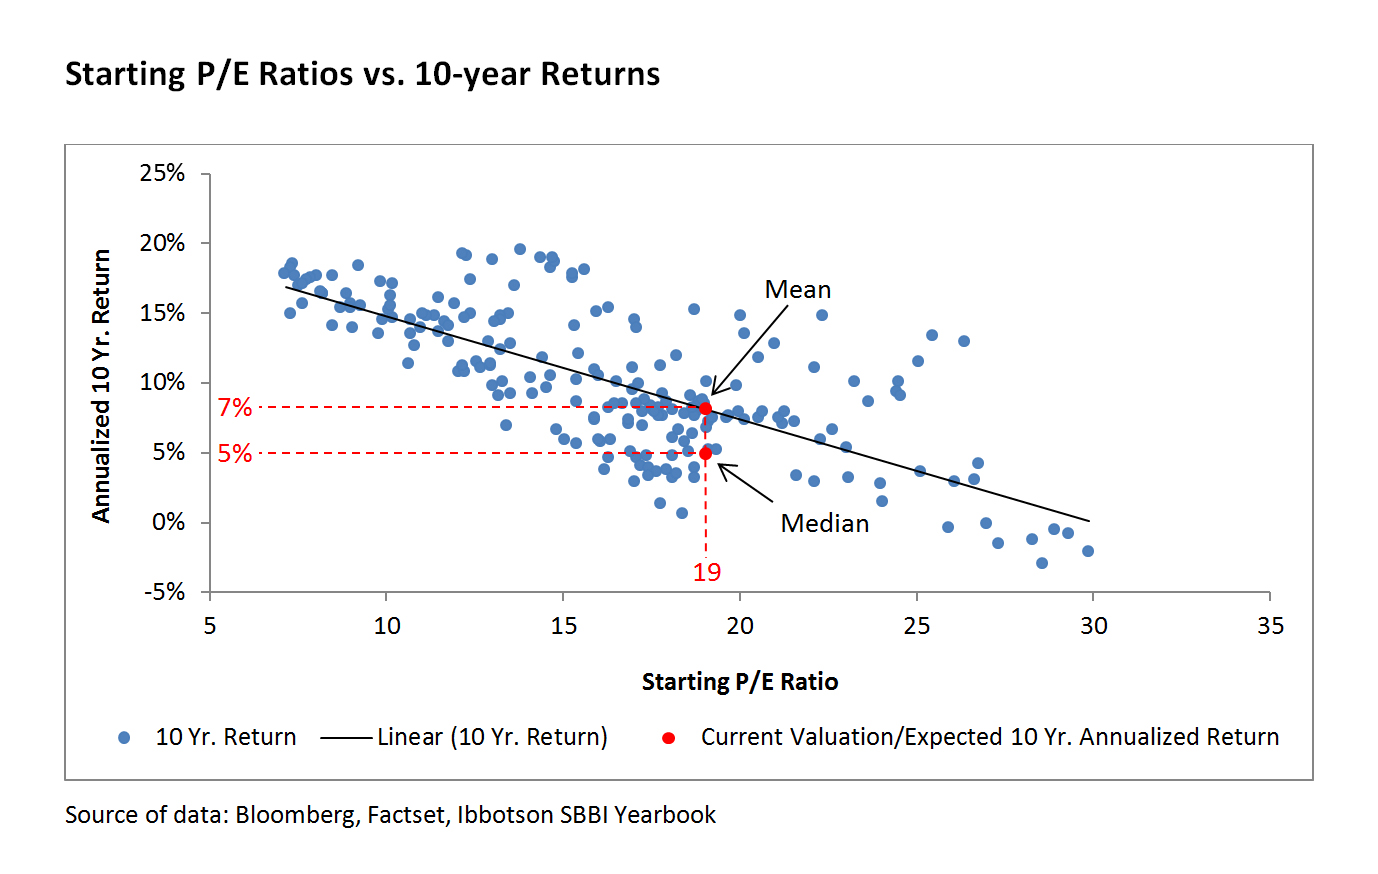
That being said, all stock market cycles are unique and it is difficult to predict exactly where we are in the cycle. However, we can look to valuation (gravity) to help us set expectations for future returns based on what we have seen in the past. Examining S&P 500 Index data going back to 1954, it is evident that there is a strong negative relationship between the level of valuation, represented by the price/earnings (P/E) ratio, and annualized returns over the subsequent 10-year period.
For example, if you have the opportunity to invest when the overall market P/E is 10 (a weak gravitational force), your predicted annualized return over the next 10 years is 15%. If you invest when the overall P/E level is 30 (a strong gravitational force), then your expected return should be 0% over the next 10 years.
The current valuation of the S&P 500 is 19 times forward earnings. While variations can be significant, using this simple view of the market’s ability to deliver growth for investors over the next decade, expectations should be modest. The historical average expected annualized return is about 7%. With that said, the average may be somewhat misleading here because it is pulled up by a high outlier return. The median is perhaps closer to 4% or 5%. Either way, we expect returns from here to be lower than recent experience and most investors’ expectations of long-run returns for stocks.
While it is easy to get caught up in the hopes that this time will be different, we don’t expect to see trees growing to the sky anytime soon – and advise investors not to presume this either.
This post is presented for illustrative and discussion purposes only. The information contained in this post is the opinion of Burgundy Asset Management and/or its employees. Investors are advised that their investments are not guaranteed, their values may change frequently and past performance may not be repeated. From time to time, markets may experience high volatility or irregularities, resulting in returns that differ from historical averages. This volatility can lead to returns that are lower than the historical annualized averages or may also result in losses. Under no circumstances does this post suggest that you should time the market in any way and no investment decisions should be made based on the content of this post.


