Investment Strategies
FOR INSTITUTIONS
China Equity at a Glance
Year Launched
2020
Geography
Companies with a majority of revenues generated in China
Market Cap
Min. US$500 million at initial purchase
Number of Holdings
Concentrated: 15-25
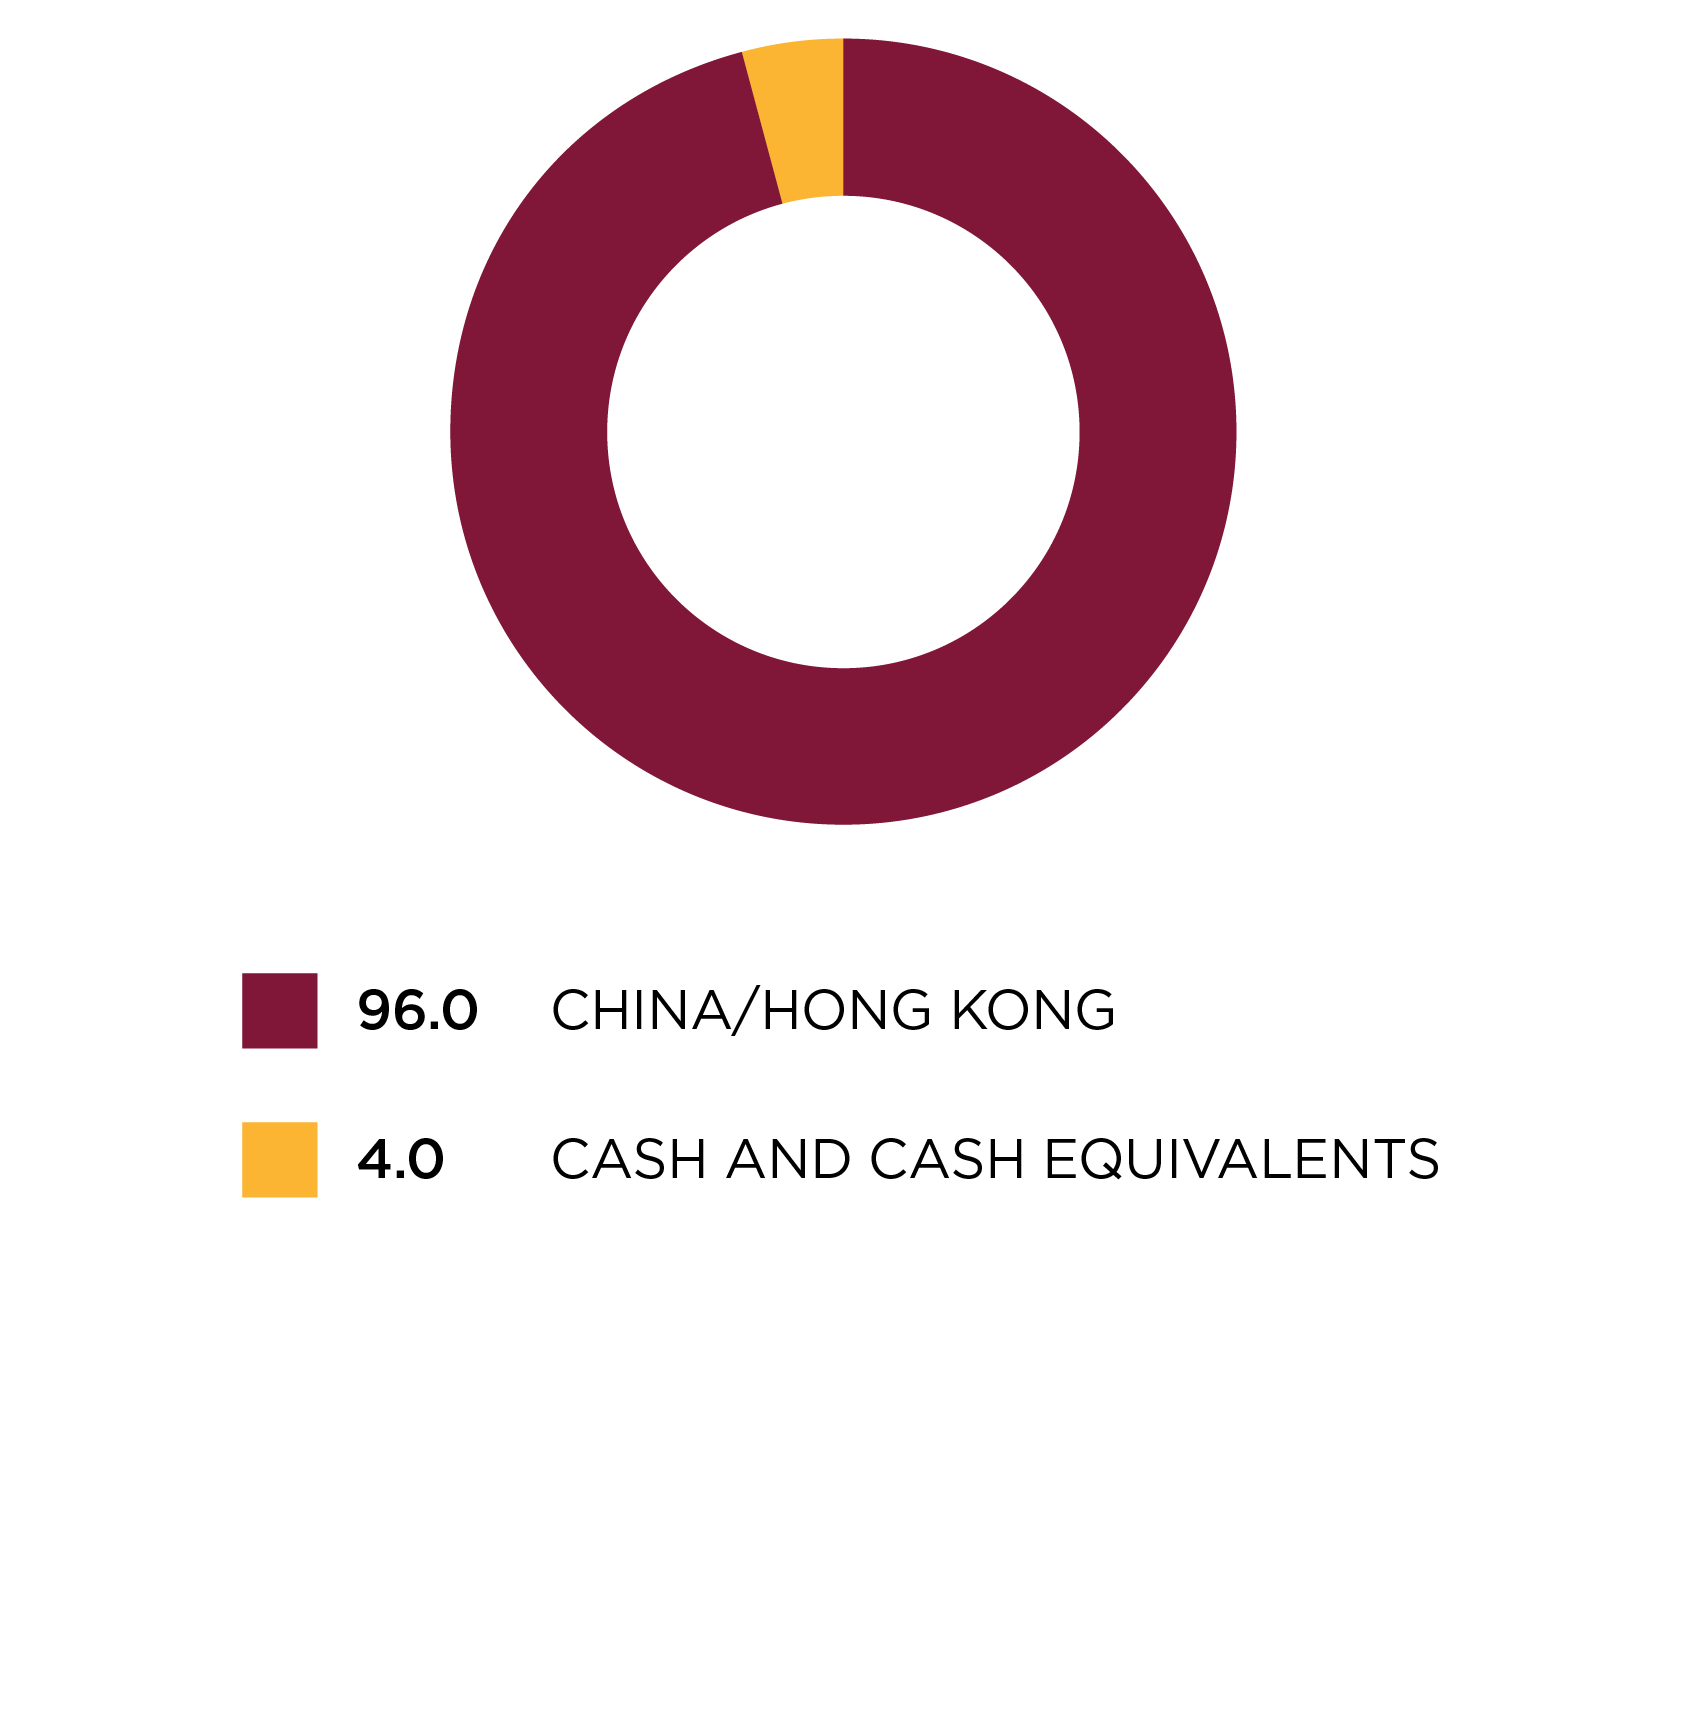
Portfolio Breakdown
Active Share
77%
Average Annual Turnover
27%
Position Sizing
Maximum 10% of market value in any one company
Sector Limits
Although the Fund will not have explicit sector targets or limits, it will seek to be adequately diversified
Regional Allocation (%)


As at December 31, 2023.
Active Share
Active share measures the degree to which a fund differs from its respective benchmark — the higher the active share, the lower the fund’s correlation to its benchmark (100 being completely different from the benchmark and zero being a replica of the benchmark).
Active share is calculated for the Burgundy China Equity Fund vs. MSCI China Index. Source: FactSet.
Average Annual Turnover
10-year average annual turnover is calculated using full calendar year portfolio turnover figures only. Partial inception year turnover figures are also excluded from the calculation, where applicable. Newer strategies are calculated since inception.

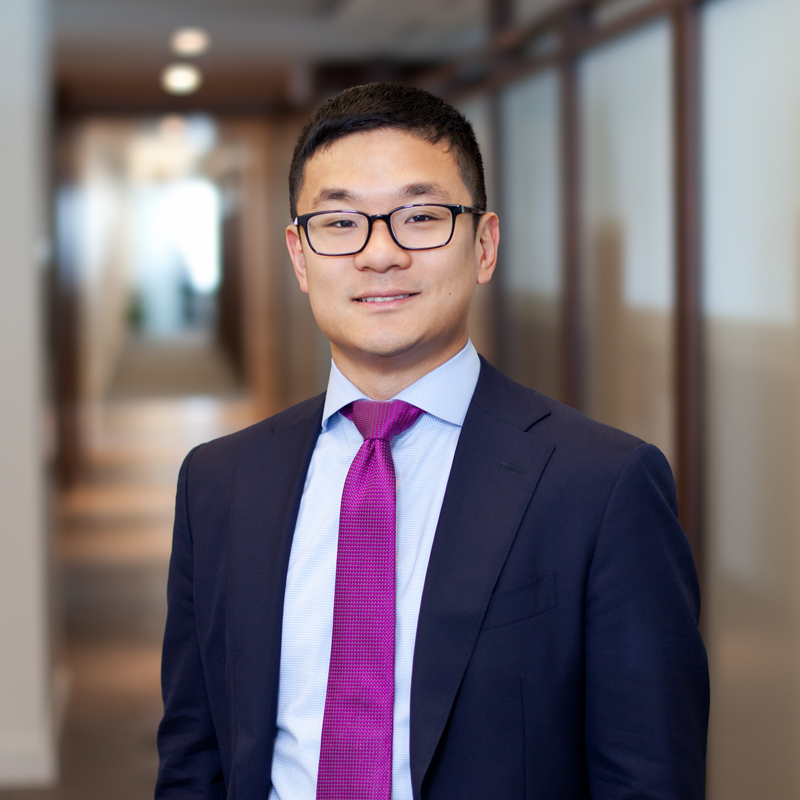
Portfolio Manager
CHING CHANG, CFA
VICE PRESIDENT, PORTFOLIO MANAGER
- Joined Burgundy in 2016
- 10+ years of combined professional experience
Learn More
Investment Team
Burgundy’s Investment Team consists of decentralized, autonomous, regional teams working in a unified, collaborative, idea-sharing environment in Toronto, Canada.
The Team concentrates on bottom-up fundamental research, frequently travelling around the world to study companies up close and meet with management teams face-to-face.
13
Portfolio Managers
17
Investment Analysts
469
Years Combined Experience
Contact us to learn more
KYLE COATSWORTH, CFA
VICE PRESIDENT, HEAD OF INSTITUTIONAL
